2 answers
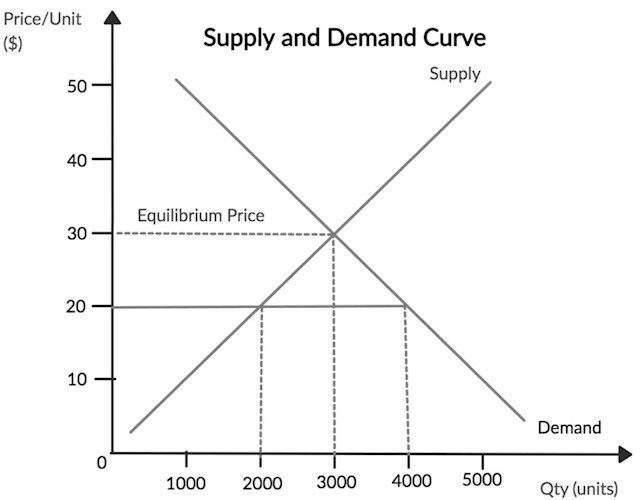
The relationship between demand, supply, price, and quantity can be represented graphically on a graph called a supply and demand curve.
Demand represents the quantity of a good or service that consumers are willing and able to purchase at a certain price, while supply represents the quantity of the same good or service that producers are willing and able to sell at that price.
When price increases, the quantity demanded typically decreases and the quantity supplied typically increases. This is known as the law of demand and the law of supply, respectively.
The intersection of the demand and supply curves is called the market equilibrium, which represents the price and quantity where the quantity demanded equals the quantity supplied.
If the price is set too high above the market equilibrium, there will be excess supply, meaning producers will be producing more than consumers are willing to purchase. As a result, producers will lower their prices in order to sell more of their goods, which will lead to a decrease in the supply and an increase in the demand until the market reaches a new equilibrium.
If the price is set too low below the market equilibrium, there will be excess demand, meaning consumers will be demanding more than producers are willing to supply. As a result, producers will raise their prices in order to maximize profits, which will lead to an increase in the supply and a decrease in the demand until the market reaches a new equilibrium.